Investing on Wall Street has been nothing short of an adventure since this decade began. The iconic Dow Jones Industrial Average (DJINDICES: ^DJI), broad-based S&P 500 (SNPINDEX: ^GSPC), and innovation-driven Nasdaq Composite (NASDAQINDEX: ^IXIC) have all bounced between bear and bull markets in successive years.
Although some degree of volatility is inherent when putting your money to work on Wall Street, it doesn't stop investors from trying to guess which direction the Dow Jones, S&P 500, and Nasdaq Composite will head next. One recession barometer, which has a flawless track record when back-tested to 1959, offers a big clue of what may be next for the U.S. economy and stock market.
To be completely transparent, there is no such thing as a perfect or foolproof predictive indicator that can, with 100% accuracy, guarantee which way the three major stock indexes will move. But there are metrics, economic data points, and forecasting tools that have remarkable long-term correlations with moves in the stock market. The Conference Board Leading Economic Index (LEI) just happens to be one of those key tools.
The LEI contains 10 inputs and is reported monthly. Three of its inputs are financial in nature and include the proprietary Leading Credit Index and performance of the S&P 500. The remaining seven inputs are nonfinancial and feature data points on average weekly manufacturing hours, average weekly initial unemployment insurance claims, and the ISM Manufacturing New Orders Index, to name a few.
In the Conference Board's own words, "The LEI is a predictive variable that anticipates (or "leads") turning points in the business cycle by around seven months." In other words, the LEI has the potential to signal economic weakness prior to an official recession being declared by the National Bureau of Economic Research.
For the month of December, the LEI declined by 0.1%, with the six-month growth rate coming in at a decline of 2.9%. While this represents a more modest drop from previous months and prior rolling six-month periods, it still marked the 21st consecutive month of declines for the LEI. When back-tested to 1959, only the 24-month drop during the financial crisis (2007-2009) and 22-month swoon during the 1973-1975 recession have lasted longer.
However, the length of consecutive LEI declines represents just one part of the story. Historically speaking, the year-over-year change in the LEI has been even more telling with regard to forecasting downturns in the U.S. economy.
When back-tested 65 years, there have been numerous instances where the year-over-year change in the LEI has declined by a modest 0.1% to 3.9%. These levels serve as moments of caution, but aren't indicative of a U.S. recession. By comparison, every instance where the LEI has fallen by at least 4% on a year-over-year basis since 1959 has correlated with a U.S. recession.
Though the magnitude of the current year-over-year decline in the LEI has recently lessened, it's still nearly double the arbitrary threshold of a 4% drop that's historically had a perfect track record of forecasting U.S. recessions. In plain terms, the LEI strongly suggests a recession is likely in 2024.
Even though stocks and the U.S. economy aren't joined at the hip, a weaker economy would be expected to adversely impact corporate earnings. Throughout history, the bulk of the S&P 500's drawdowns have occurred after, not prior to, a recession being declared. In short, the LEI appears to portend a difficult year for equities.
As much as I'd like to tell you that the LEI is the lone predictive index forecasting a downturn in the U.S. economy, it wouldn't be the truth. A couple of other widely followed metrics with uncanny track records of success also signal a high likelihood of recession.
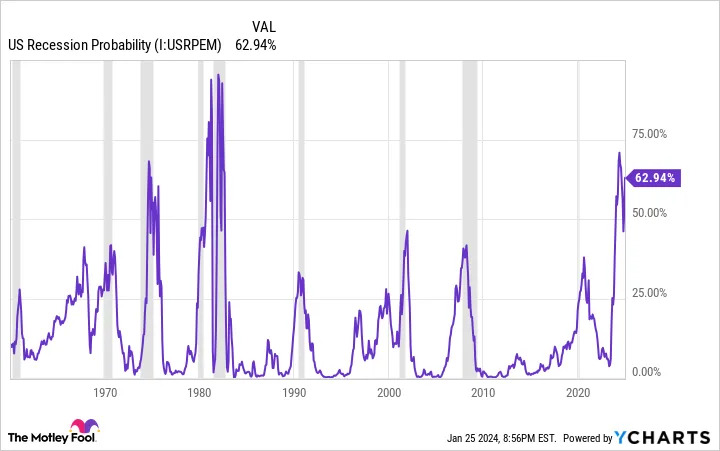
The first recession indicator with a near-perfect track record of forecasting downturns is the Federal Reserve Bank of New York's recession probability tool. The NY Fed's predictive tool examines the spread (i.e., difference in yield) between the 10-year Treasury bond and three-month Treasury bill to determine how likely it is that a recession will take place in the coming 12 months.
Normally, the Treasury yield curve slopes up and to the right, with longer-dated bonds have higher yields than short-term bills. Trouble arises when the yield curve inverts and short-term bills outpace the yields of longer-dated bonds. The steeper the inversion, the greater the likelihood of a recession.
Let me preface this by saying that not every yield-curve inversion has been followed by a recession. However, every recession since World War II has been preceded by a yield-curve inversion. It's been a telltale ingredient of U.S. recessions for nearly eight decades.
With the yield-curve inversion hitting its steepest point in roughly four decades, the New York Fed's tool is forecasting a nearly 63% probability of a recession taking place by or before December 2024.
The other potentially damning metric over the short run is M2 money supply. M2 accounts for everything in M1 (cash and coins in circulation, along with demand deposits in a checking account), and adds in money market accounts, savings accounts, and certificates of deposit (CDs) below $100,000.
M2 is one of those metrics that rises so steadily over time that some economists fail to pay attention to it. Since growing economies require more cash to facilitate transactions, M2 has a tendency to rise over long periods.
However, there have been five instances over the past 154 years when M2 money supply shrank by at least 2% on a year-over-year basis (1878, 1893, 1921, 1931-1933, and 2023-current). During the four previous instances where M2 meaningfully dropped, deflationary depressions with higher unemployment rates followed.
The idea here is that as money supply declines, consumers purchase fewer discretionary goods and services, which has a negative impact on corporate earnings. Although fiscal and monetary policy have evolved in a big way over the past century, the takeaway is that a notable decline in M2 has been a telltale signal of economic weakness.
While nothing is set in stone (remember, there's no such thing as a foolproof indicator), multiple forecasting tools and metrics point to a challenging year for the U.S. economy, and therefore equities as a whole. But even if these forecasts are accurate, patient investors have little to worry about.
Recessions aren't something investors or workers look forward to. They usually lead to weaker wage growth and higher unemployment. But something recessions are also known for is being short-lived.
In the 78-plus years since World War II ended, there have been 12 official U.S. recessions. Nine of these 12 recessions failed to last 12 months, while the remaining three were resolved in 18 or fewer months. By comparison, most expansions have endured multiple years, with two periods of growth lasting for at least a decade. Thanks to an assortment of fiscal and monetary tools, recessions don't stick around very long.
Bear markets usually don't last long, either. This past June, the researchers at Bespoke Investment Group published a data set that laid out the length of every bull and bear market in the benchmark S&P 500 dating back to the start of the Great Depression in September 1929.
As you can see from this data set, the average S&P 500 bear market has lasted just 286 calendar days, or about 9.5 months, over the past 94 years. Meanwhile, the typical bull market has endured for 1,011 calendar days, which is about 3.5 times as long.
I'll also add to the above that, except for the 2022 bear market, every stock market correction, crash, and bear market in the Dow Jones, S&P 500, and Nasdaq Composite has eventually been cleared away by a bull market rally. Although we're never going to be able to pinpoint ahead of time when downturns will begin, how long they'll last, or how steep the ultimate drop will be, history has clearly shown that buying these dips has made sense for investors with a long-term mindset.
There's no denying that predicting short-term directional moves in the stock market is difficult. But it's an undeniable fact that time is investors' greatest ally. Those who take a long-term approach to their investments are in great shape, no matter what the U.S. economy throws their way in 2024.
When our analyst team has an investing tip, it can pay to listen. After all, the newsletter they have run for over a decade, Motley Fool Stock Advisor, has tripled the market.*
They just revealed what they believe are the ten best stocks for investors to buy right now... and Walmart wasn't one of them! That's right -- they think these 10 stocks are even better buys.